Coal Age Magazine - For nearly 100 years, Coal Age has been the magazine that readers can trust for guidance and insight on this important industry.
Issue link: https://coal.epubxp.com/i/138480
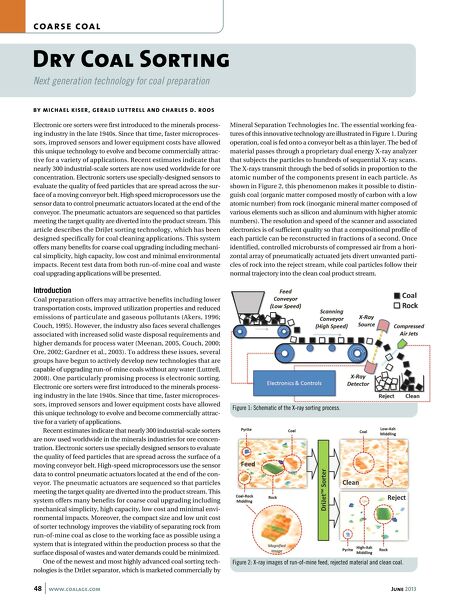
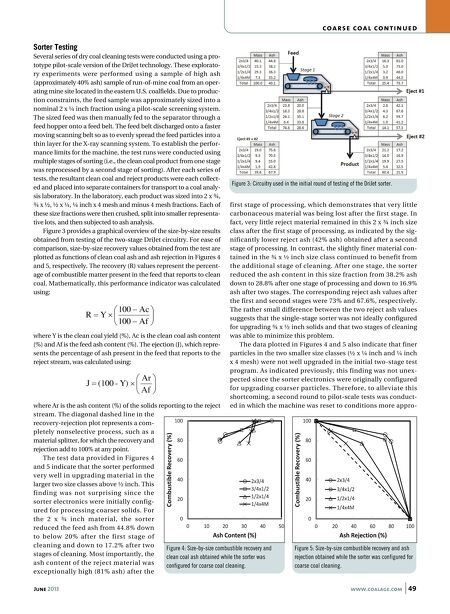
coarse coal continued Sorter Testing Several series of dry coal cleaning tests were conducted using a prototype pilot-scale version of the DriJet technology. These exploratory experiments were performed using a sample of high ash (approximately 40% ash) sample of run-of-mine coal from an operating mine site located in the eastern U.S. coalfields. Due to production constraints, the feed sample was approximately sized into a nominal 2 x ¼ inch fraction using a pilot-scale screening system. The sized feed was then manually fed to the separator through a feed hopper onto a feed belt. The feed belt discharged onto a faster moving scanning belt so as to evenly spread the feed particles into a thin layer for the X-ray scanning system. To establish the performance limits for the machine, the test runs were conducted using multiple stages of sorting (i.e., the clean coal product from one stage was reprocessed by a second stage of sorting). After each series of tests, the resultant clean coal and reject products were each collected and placed into separate containers for transport to a coal analysis laboratory. In the laboratory, each product was sized into 2 x ¾, ¾ x ½, ½ x ¼, ¼ inch x 4 mesh and minus 4 mesh fractions. Each of these size fractions were then crushed, split into smaller representative lots, and then subjected to ash analysis. Figure 3 provides a graphical overview of the size-by-size results obtained from testing of the two-stage DriJet circuitry. For ease of comparison, size-by-size recovery values obtained from the test are plotted as functions of clean coal ash and ash rejection in Figures 4 and 5, respectively. The recovery (R) values represent the percentage of combustible matter present in the feed that reports to clean coal. Mathematically, this performance indicator was calculated using: where Y is the clean coal yield (%), Ac is the clean coal ash content (%) and Af is the feed ash content (%). The ejection (J), which represents the percentage of ash present in the feed that reports to the reject stream, was calculated using: Figure 3: Circuitry used in the initial round of testing of the DriJet sorter. first stage of processing, which demonstrates that very little carbonaceous material was being lost after the first stage. In fact, very little reject material remained in this 2 x ¾ inch size class after the first stage of processing, as indicated by the significantly lower reject ash (42% ash) obtained after a second stage of processing. In contrast, the slightly finer material contained in the ¾ x ½ inch size class continued to benefit from the additional stage of cleaning. After one stage, the sorter reduced the ash content in this size fraction from 38.2% ash down to 28.8% after one stage of processing and down to 16.9% ash after two stages. The corresponding reject ash values after the first and second stages were 73% and 67.6%, respectively. The rather small difference between the two reject ash values suggests that the single-stage sorter was not ideally configured for upgrading ¾ x ½ inch solids and that two stages of cleaning was able to minimize this problem. The data plotted in Figures 4 and 5 also indicate that finer particles in the two smaller size classes (½ x ¼ inch and ¼ inch x 4 mesh) were not well upgraded in the initial two-stage test program. As indicated previously, this finding was not unexpected since the sorter electronics were originally configured for upgrading coarser particles. Therefore, to alleviate this shortcoming, a second round to pilot-scale tests was conducted in which the machine was reset to conditions more appro- where Ar is the ash content (%) of the solids reporting to the reject stream. The diagonal dashed line in the recovery-rejection plot represents a completely nonselective process, such as a material splitter, for which the recovery and rejection add to 100% at any point. The test data provided in Figures 4 and 5 indicate that the sorter performed very well in upgrading material in the larger two size classes above ½ inch. This finding was not surprising since the sorter electronics were initially configured for processing coarser solids. For the 2 x ¾ inch material, the sorter reduced the feed ash from 44.8% down to below 20% after the first stage of cleaning and down to 17.2% after two Figure 4: Size-by-size combustible recovery and stages of cleaning. Most importantly, the clean coal ash obtained while the sorter was ash content of the reject material was configured for coarse coal cleaning. exceptionally high (81% ash) after the June 2013 Figure 5: Size-by-size combustible recovery and ash rejection obtained while the sorter was configured for coarse coal cleaning. www.coalage.com 49