Coal Age Magazine - For more than 100 years, Coal Age has been the magazine that readers can trust for guidance and insight on this important industry.
Issue link: https://coal.epubxp.com/i/975717
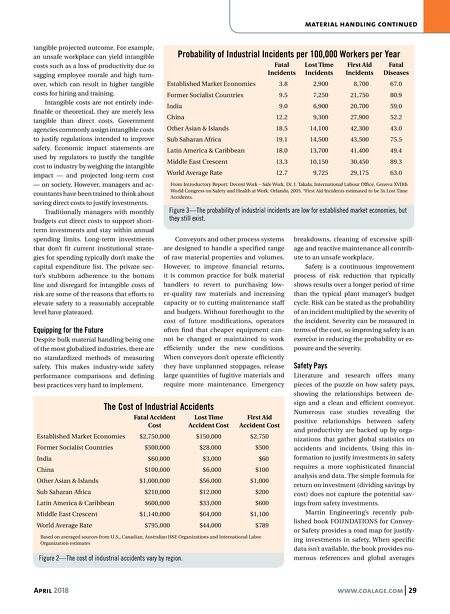
April 2018 www.coalage.com 29 material handling continued tangible projected outcome. For example, an unsafe workplace can yield intangible costs such as a loss of productivity due to sagging employee morale and high turn- over, which can result in higher tangible costs for hiring and training. Intangible costs are not entirely inde- finable or theoretical, they are merely less tangible than direct costs. Government agencies commonly assign intangible costs to justify regulations intended to improve safety. Economic impact statements are used by regulators to justify the tangible cost to industry by weighing the intangible impact — and projected long-term cost — on society. However, managers and ac- countants have been trained to think about saving direct costs to justify investments. Traditionally managers with monthly budgets cut direct costs to support short- term investments and stay within annual spending limits. Long-term investments that don't fit current institutional strate- gies for spending typically don't make the capital expenditure list. The private sec- tor's stubborn adherence to the bottom line and disregard for intangible costs of risk are some of the reasons that efforts to elevate safety to a reasonably acceptable level have plateaued. Equipping for the Future Despite bulk material handling being one of the most globalized industries, there are no standardized methods of measuring safety. This makes industry-wide safety performance comparisons and defining best practices very hard to implement. Conveyors and other process systems are designed to handle a specified range of raw material properties and volumes. However, to improve financial returns, it is common practice for bulk material handlers to revert to purchasing low- er-quality raw materials and increasing capacity or to cutting maintenance staff and budgets. Without forethought to the cost of future modifications, operators often find that cheaper equipment can- not be changed or maintained to work efficiently under the new conditions. When conveyors don't operate efficiently they have unplanned stoppages, release large quantities of fugitive materials and require more maintenance. Emergency breakdowns, cleaning of excessive spill- age and reactive maintenance all contrib- ute to an unsafe workplace. Safety is a continuous improvement process of risk reduction that typically shows results over a longer period of time than the typical plant manager's budget cycle. Risk can be stated as the probability of an incident multiplied by the severity of the incident. Severity can be measured in terms of the cost, so improving safety is an exercise in reducing the probability or ex- posure and the severity. Safety Pays Literature and research offers many pieces of the puzzle on how safety pays, showing the relationships between de- sign and a clean and efficient conveyor. Numerous case studies revealing the positive relationships between safety and productivity are backed up by orga- nizations that gather global statistics on accidents and incidents. Using this in- formation to justify investments in safety requires a more sophisticated financial analysis and data. The simple formula for return on investment (dividing savings by cost) does not capture the potential sav- ings from safety investments. Martin Engineering's recently pub- lished book FOUNDATIONS for Convey- or Safety provides a road map for justify- ing investments in safety. When specific data isn't available, the book provides nu- merous references and global averages Figure 2—The cost of industrial accidents vary by region. The Cost of Industrial Accidents Fatal Accident Lost Time First Aid Cost Accident Cost Accident Cost Established Market Economies $2,750,000 $150,000 $2,750 Former Socialist Countries 0, $500,000 0 $28,000 0, $500 India 00, $60,000 00 $3,000 00, $60 China 0, $100,000 00 $6,000 0, $100 Other Asian & Islands $1,000,000 0 $56,000 $1,000 Sub Saharan Africa 0, $210,000 0 $12,000 0, $200 Latin America & Caribbean 0, $600,000 0 $33,000 0, $600 Middle East Crescent $1,140,000 0 $64,000 $1,100 World Average Rate 0, $795,000 0 $44,000 0, $789 Based on averaged sources from U.S., Canadian, Australian HSE Organizations and International Labor Organization estimates Figure 3—The probability of industrial incidents are low for established market economies, but they still exist. Probability of Industrial Incidents per 100,000 Workers per Year Fatal Lost Time First Aid Fatal Incidents Incidents Incidents Diseases Established Market Economies 0 3.8 0 2,900 0 8,700 67.0 Former Socialist Countries 0 9.5 0 7,250 21,750 80.9 India 0 9.0 0 6,900 20,700 59.0 China 12.2 0 9,300 27,900 52.2 Other Asian & Islands 18.5 14,100 42,300 43.0 Sub Saharan Africa 19.1 14,500 43,500 75.5 Latin America & Caribbean 18.0 13,700 41,400 49.4 Middle East Crescent 13.3 10,150 30,450 89.3 World Average Rate 12.7 0 9,725 29,175 63.0 From Introductory Report: Decent Work – Safe Work, Dr. J. Takala, International Labour Office, Geneva XVIIth World Congress on Safety and Health at Work, Orlando, 2005. *First Aid Incidents estimated to be 3x Lost Time Accidents.